Article

Economic Loss of Pine Wood Nematode Disease in Mainland China from 1998 to 2017

1
Key Laboratory for Silviculture and Conservation of Ministry of Education, Beijing Forestry University, Beijing 100083, China
2
College of Resources and Environment, University of Chinese Academy of Sciences, Beijing 100049, China
3
Key Laboratory of Land Surface Pattern and Simulation, Chinese Academy of Science, Beijing 100101, China
4
General Station of Forest and Grassland Pest Management, National Forestry and Grassland Administration/Key Laboratory of National Forestry and Grassland Administration on Forest and Grassland Pest Monitoring and Warning, Shenyang 110034, China
*
Authors to whom correspondence should be addressed.
Forests 2020, 11(10), 1042; https://doi.org/10.3390/f11101042
Submission received: 14 July 2020 / Revised: 9 September 2020 / Accepted: 22 September 2020 / Published: 27 September 2020

Abstract

:
The occurrence and prevalence of pine wood nematode disease has had a great impact on China’s forestry production and ecological environment, but the quantitative evaluation of the economic losses of this biological disease is lacking from a macro-geographic scale and long-term series perspective. This study establishes a pine wood nematode disease economic loss evaluation index system, covering the loss of natural ecology, landscape aesthetics and economic production, and quantitatively evaluates the economic losses of pine wood nematode disease in mainland China at a provincial level from 1998 to 2017. The results show that the economic losses of the pine wood nematode disease in China showed a fluctuant rising trend from 1998, since 2013, it has entered a full-scale outbreak phase, and since 2015, the economic loss has increased significantly, with a growth rate higher than 40%. The average annual total economic loss is CNY 7.17 billion, of which the direct economic losses is CNY 1.53 billion, and the indirect economic losses is CNY 5.64 billion. The loss of forest material resources, the expenditure of ineffective forest management expenditure and prevention and control expenditure were CNY 817 million, CNY 649 million, and CNY 67 million, respectively. Regulate service value loss, support service value loss and cultural service loss are CNY 3.95 billion, CNY 1.41 billion, CNY 276 million, respectively. East China and South China suffered the most due to pine wood nematode disease, and the economic loss of these regions accounted for 79.9% of the total national economic losses. Among them, Zhejiang Province, Guangdong Province and Jiangsu Province lost CNY 2.14 billion, CNY 1.81 billion, and CNY 1.22 billion, respectively, accounting for 26.8%, 22.7% and 15.3% of the total national economic loss.

1. Introduction

Pests and diseases are the main cause of forest damage [1], and the economic losses caused mainly include the loss of forest assets [2], the discounted expenditure of the disposal, removal and replacement of damaged trees [3,4], the loss of forest recreational and landscape value [5] and the loss of carbon sinks [6]. Infected by diseases and insect pests, 85 million hectares of forests worldwide were destroyed between 2003 and 2012, and the most of the disease occurred in temperate North America [7]. China’s average annual economic losses caused by forest pests and diseases in 1996–2010 exceeded CNY 100 billion, including direct economic losses and loss of ecological service value [8,9,10].
Pine wood nematode disease is native to North America, and is mainly distributed in Portugal and Spain in North America, East Asia and Europe [11,12,13]. In China, Japan, South Korea, Portugal and Spain, pine wood nematode disease has caused massive deaths of pine trees, leading to severe economic losses [14,15]. China first discovered pine wood nematodes in the Sun Yat-sen Mausoleum in Nanjing in 1982. After nearly 40 years of spreading, the area infected by pine wood nematode disease in 2019 expanded to 588 counties of 18 provinces (autonomous regions, municipalities) in the country [16]. What is more serious is that pine wood nematodes have a tendency to break through the previous suitable geo-environment range and spread northward and toward high altitudes. The middle temperate zone has become the front line for pine wood nematode disease prevention and control [17].
The rapid spread of pine wood nematode disease has caused huge economic losses to the infected countries. These losses come from direct wood loss on the one hand [18,19,20], and expenditure incurred to reduce the spread or impact of pine nematode disease [21,22], including spraying pesticides, felling, fumigation or burning infected trees [23,24], as well as economic losses due to the loss of export markets and import restrictions due to pine wood nematodes [25]. According to evaluations, the average annual economic loss of pine wood nematode disease in China is CNY 7.8 billion [26], and the economic loss in Zhejiang province, where the pine wood nematode disease is the most severe, was CNY 621 million in 2004 [27].
The research on the economic loss evaluation of forestry biological disease is mainly focused on the construction of evaluation theory and index system [28,29,30,31]. There are very limited studies on the economic loss evaluation covering macro-geographic scales and long-term sequences. In view of this, using the provincial-level incidence data of pine wood nematode disease in China from 1998 to 2017, this study constructs a pine wood nematode disease economic loss evaluation index and quantifies the economic loss in China.

2. Materials and Methods

2.1. Study Site and Data

Pine wood nematode was firstly introduced to Nanjing, China in 1982, and rapidly spread to surrounding provinces. Now pine wood nematode disease has occurred in most areas of southern China and some north regions such as Shaanxi province and Liaoning province. With the global climate change, pine wood nematode disease continues to spread northward. This study was conducted in mainland China with wide area coverage—the forest ecosystems between regions has obvious spatial heterogeneity, and the geographical conditions and seasonal climate are very different [32].
The data of this study included the province-level pine wood nematode disease area from 1998 to 2017 in mainland China. The data were from the National Forestry and Grassland Bureau’s National Center for Forest Pests and Diseases Monitoring Network, the national, provincial, prefecture (city) and county-level reporting agencies, and the statistical processing system of the Forest Pest Information Center of the National Forestry and Grassland Bureau. The annual diseased area of pine wood nematode disease came from forestry surveys.
The pine wood nematode disease economic loss evaluation included direct economic loss and indirect economic loss. The direct economic loss evaluation using the yield and prices of rice, wheat, and corn planted in the country from 1998 to 2017, which are from China Statistical Yearbook and BRIC Agricultural Data Terminal. The indirect economic loss evaluation combines converted data, including the forestry output value index and the Engel coefficient. These data are at national level. In order to achieve provincial-level evaluation, we converted the national data using rainfall and GPP data.
National rainfall data from 1998 to 2017 were obtained from China Meteorological Data Service Center-China Meteorological Data Network (http://data.cma.cn/); the GPP (gross primary productivity) data from 1998 to 2017 came from the National Science and Technology Infrastructure-National Earth System Science Data Center (http://www.geodata.cn/).

2.2. Economic Loss Evaluation

Referring to the “Specifications for assessment of forest Ecosystem Services in China” [33] and the Disease Criteria for Major Forestry Pests [34], we selected a set of evaluation indicators that can reflect the pine wood nematode disease, and made some necessary revisions to the indicators to meet the principles of science and practicality at the same time. Pine wood nematode control mostly adopts physical eradication methods such as small-scale clearing and burning of infectious wood [35,36]. Therefore, we firstly discarded the indicators of live-wood grade reduction loss commonly used in previous evaluations [30]. The deformation calculation formula of forest by-products was also modified. The calculation results do not include the losses caused by the decline in product quality.
Secondly, considering that the value of standing trees and the value of forest land use are mainly based on the afforestation expenditure, prevention and control expenditure, and economics value of forest products [37,38], to avoid duplication of evaluation content, we used forest expenditure instead.
Two evaluation methods covering direct and indirect economic loss were established. The secondary indicators and tertiary indicators are listed in Table 1. Direct loss represents the resources loss and management loss, and the indirect loss represents the service loss.

2.2.1. Direct Economic Loss Evaluation

Economic loss evaluation methods mainly include the market price method, opportunity expenditure method, contingent value method, and the benefit transfer method [39], while there is also the multiple method, which comprises the biomass estimation method and curve evaluation method [40,41]. The market price method is simple and can quickly calculate and obtain the evaluation results, while the opportunity expenditure method, the contingent value method and the benefit transfer method can better reflect people’s willingness to pay and have dynamic characteristics. The multiple method is mainly based on the results of China’s forest resource value accounting, and the evaluation results reflect the national average. In the actual assessment at the province level, there will be big differences between regions. The biomass estimation method can be applied for different regions, forest stands and forest ages, but the calculation is burdensome; the curve method requires a large number of forest stands covering tree species, thus in practice, it is difficult to collect data on the growth law of forest age and the annual growth loss rate of forest trees caused by diseases. Therefore, we chose the market value method to assess direct economic losses, which is highly practical.
Loss of forest volume: The loss of standing wood volume growth or stand cumulative growth volume caused by pine wood nematode disease. The results calculated using the formula of growing wood volume loss (Equation (1)) are shown [30].
L a = S × A d × T a
where L a is the loss of forest volume; S is the annual loss area of pine wood nematode disease; A d is the annual growth loss per unit area; and T a is the forest price per unit stock.
Loss of forest by-products: The loss of forest by-products (pine resin) caused by pine wood nematode disease is calculated using Equation (2).
L o = Y × S × P
where L o is the loss of forest by-products; Y is the annual average yield per unit area of healthy forests; S is the annual loss area of pine wood nematode disease; and P is the average price of pine resin in its origin.
Loss of prevention and control expenditure: The expenditure on investigating and monitoring the epidemic situation in epidemic areas, the removal and treatment of epidemic wood, the prevention and control of epidemic areas and the prevention of non-epidemic areas [42]—this is called ineffective expenditure when the forest is infected by the pine wood nematode disease. Equation (3) is used for calculation.
L p = S × C p
where L p is the loss of prevention and control expenditure; S is the annual loss area of pine wood nematode disease; and C p is the prevention and control expenditure per unit area invested.
Ineffective afforestation expenditure: The expenditure of the year of afforestation, including expenditures for forest land consolidation labor, plantation labor, seedlings, and fertilizers [43]. When the trees are infected by the pine wood nematode disease, it is called ineffective expenses, which is calculated using Equation (4).
L c = S × C c
where L c is the ineffective afforestation expenditure; S is the annual loss area of pine wood nematode disease; and C c is the afforestation expenditure per unit area invested.
Ineffective tending expenditure: The tending expenses in the year of afforestation and the following two years. When the trees are infected by the pine wood nematode disease, it is called ineffective expenses, calculated by Equation (5).
L t = S × C t
where L t is the ineffective tending expenditure; S is the annual loss area of pine wood nematode disease; and C t is the tending expenditure per unit area.
Ineffective management and maintenance expenditure: The annual forest management and maintenance expenditure after the forest is closed. When the trees are infected by the pine wood nematode disease, it is called ineffective expenditure and is calculated by Equation (6).
L m = S × C m
where L m is the ineffective management and maintenance expenditure; S is the annual loss area of pine wood nematode disease; and C m is the management and maintenance expenditure invested per unit area. The values of these parameters are list in Table 2.

2.2.2. Indirect Economic Loss Evaluation Method

The indirect economic loss caused by forest diseases and insect pests mainly comes from the loss of non-market economic value [44], including the loss to the social and ecological environment. Although the indirect economic loss of forest pests and diseases and the loss of the value of forest ecosystem services are two different concepts, they are consistent in the evaluation content [30].
The method for evaluating the value of forest ecosystem services was firstly created by Constanza et al. in Nature [45]. The evaluation was based on the economic theory that the total economic value of resources is the sum of the surplus of producers and consumers. Since then, domestic scholars have evaluated the service value of China’s terrestrial ecosystems on the basis of this, and they all used parameters provided by Constanza in their evaluation process [46,47,48].
Through a questionnaire survey, Xie et al. obtained an equivalent scale of ecological service value per unit area of the ecosystem, and constructed a method for valuing ecosystem services [49]. Later, using model calculations and geographic information spatial analysis methods, a dynamic evaluation method for the service value of China’s terrestrial ecosystem was proposed and the service value of China’s terrestrial ecosystem in 2010 was evaluated [50].
Among these methods above, the ecological service value equivalent per unit area of the ecosystem proposed by Xie’s method is more consistent with China’s national conditions and has the characteristics of dynamic evaluation. Therefore, Xie’s dynamic equivalent factor method is used for economic losses caused by wood nematode disease in this study.

The Value of One Standard Unit Ecosystem Service Value Equivalent Factor

A standard unit ecosystem service value equivalent factor (hereinafter referred to as the standard equivalent) refers to the economic value of the annual natural grain output of farmland with an average national output of 1 hm2 [51]. In order to eliminate the interference of human factors and accurately measure the economic value of the grain output by the farmland ecosystem under natural conditions, this study determined that the economic value of an ecological service value equivalent factor is equal to the national average grain yield market value [52].
In practice, the market value of the three main grain crop yields can be selected instead of the national average grain yield market value [49]. In addition, considering people’s willingness to pay for the value of forest ecosystem services, this study uses the development stage coefficients that characterize the relative level of willingness to pay to modify the theoretical value of forest ecological service values to obtain the realistic value [53].

Basic Equivalent Scale of Ecosystem Service Function Value Per Unit Area

This is achieved by referring to Xie’s [50] research and using its coniferous forest ecosystem basic equivalent table (Table 3).

Construction of Dynamic Equivalent Scale of Ecological Service Value Per Unit Area

Water supply and hydrological regulation are related to changes in precipitation. Food production, raw material production, gas regulation, climate regulation, purification of the environment, maintenance of nutrient cycles, biodiversity and aesthetic landscape functions of ecosystem are positively correlated with biomass in general, and further determined based on the spatiotemporal dynamic factors of GPP and precipitation. Combined with the Ecosystem Service Value Basic Equivalence Table, the following formula was used to construct the Ecosystem Service Spatiotemporal Dynamic Change Value Equivalent Table [49]:
F ij = { P i j × F 1   or R i j × F 2
In the formula: F ij refers to Pointer forest ecosystem’s unit area value equivalent factor in time i area j ; P i j refers to the GPP space-time adjustment factor of the ecosystem in i time j area; R i j refers to the precipitation time-space adjustment factor of the ecosystem in i time j area; F 1 indicates gas regulation, climate regulation, purify the environment, maintain nutrient cycling, maintain biodiversity, and provide aesthetic landscape services; F 2 indicates hydrological regulation or soil conservation services. The GPP spatiotemporal adjustment factor ( P i j ) and the precipitation spatiotemporal adjustment factor ( R i j ) were obtained by Xie’s method [49]; in particular, it should be noted that this study used the national average rainfall in September and GPP data for revision.

3. Results

3.1. Trends in Areas Infected by Pine Wood Nematode Disease in Mainland China from 1998 to 2017

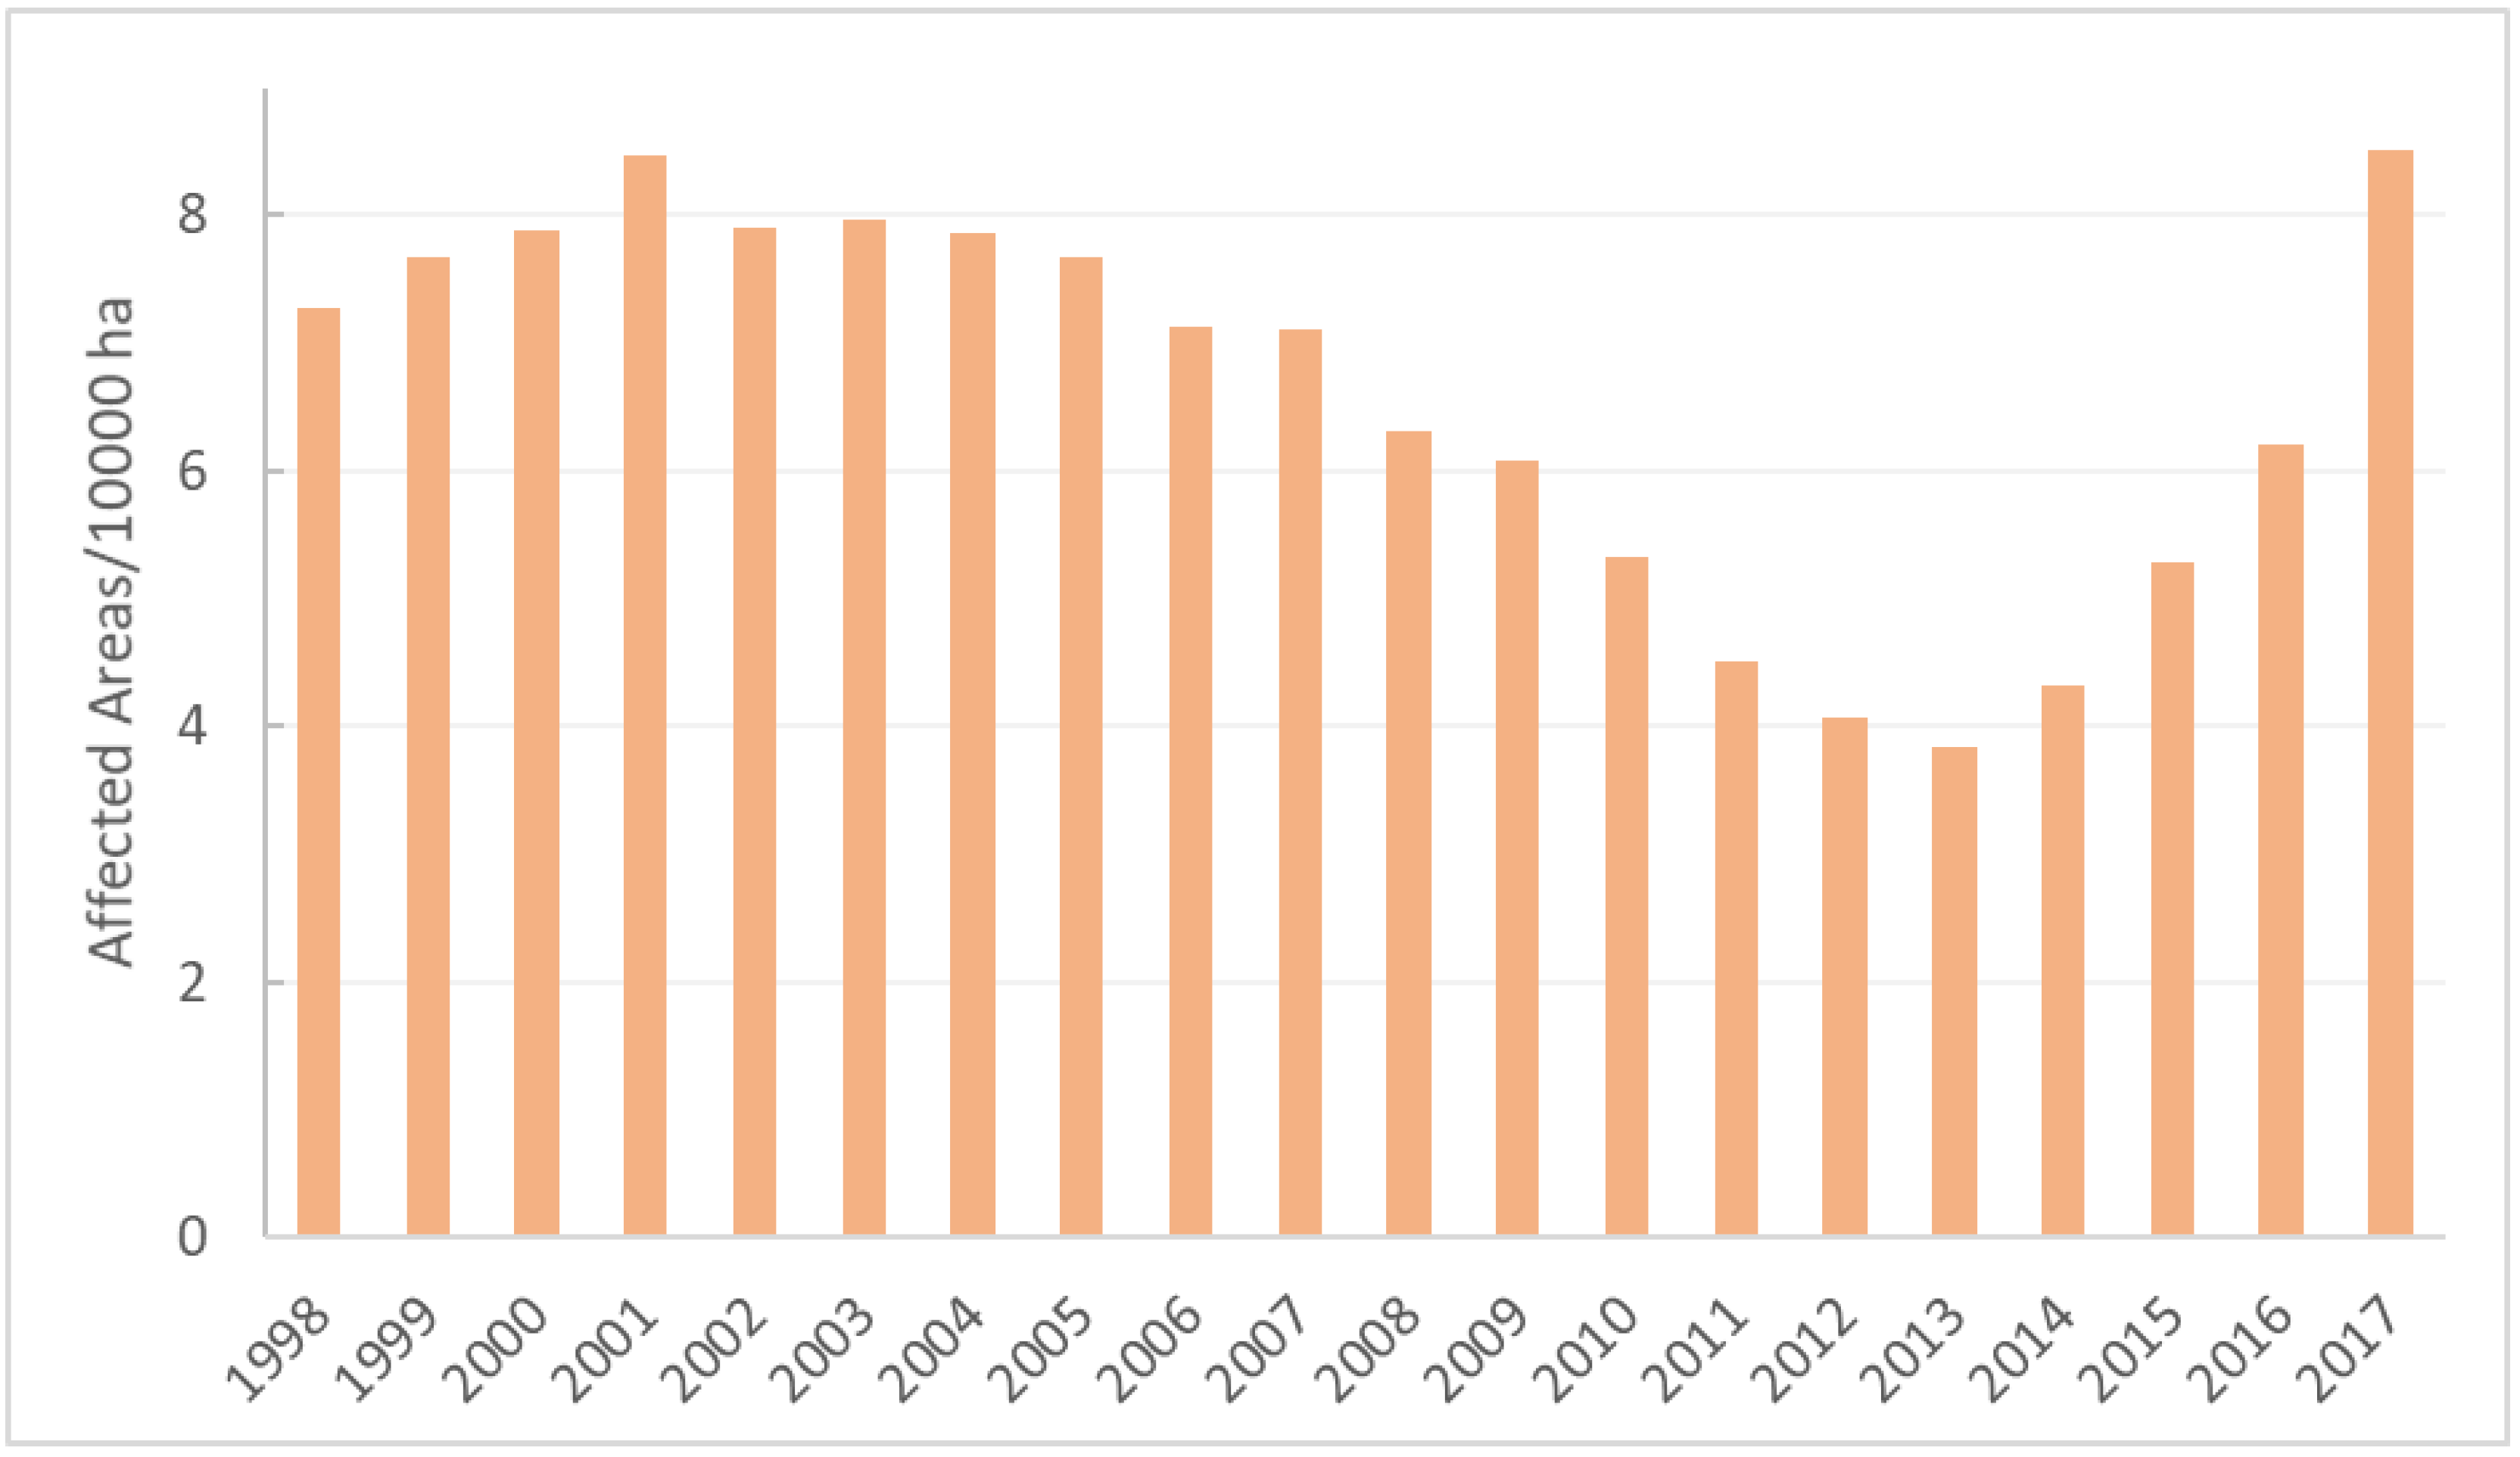
According to the fluctuation trend of the disease occurrence area, the pine wood nematode disease situation is divided into three stages in China. The first stage was from 1998 to 2001, when the pine wood nematode disease area showed a slowly rising trend. The second stage was from 2001 to 2013, during which the area of pine wood nematode disease showed a downward trend. The third stage was from 2013 to 2017, when the area of pine wood nematode disease increased rapidly (Figure 1).
The area of pine wood nematode disease showed two extremes in 2001 and 2013. During the period from 1998 to 2001, the incidence area of pine wood nematode disease increased significantly, with an average annual increase of 5%, and reached to a maximum value of 84,688 hectares in 2001. During the period from 2001 to 2013, the incidence area of pine wood nematode disease showed a downward trend, and reached a minimum of 38,356 hectares in 2013. However, since then, the epidemic has expanded again, showing a more rapid growth trend than before, with an average annual increase of 22%, and the diseased area in 2017 reached 85,024 hectares (Table A1).
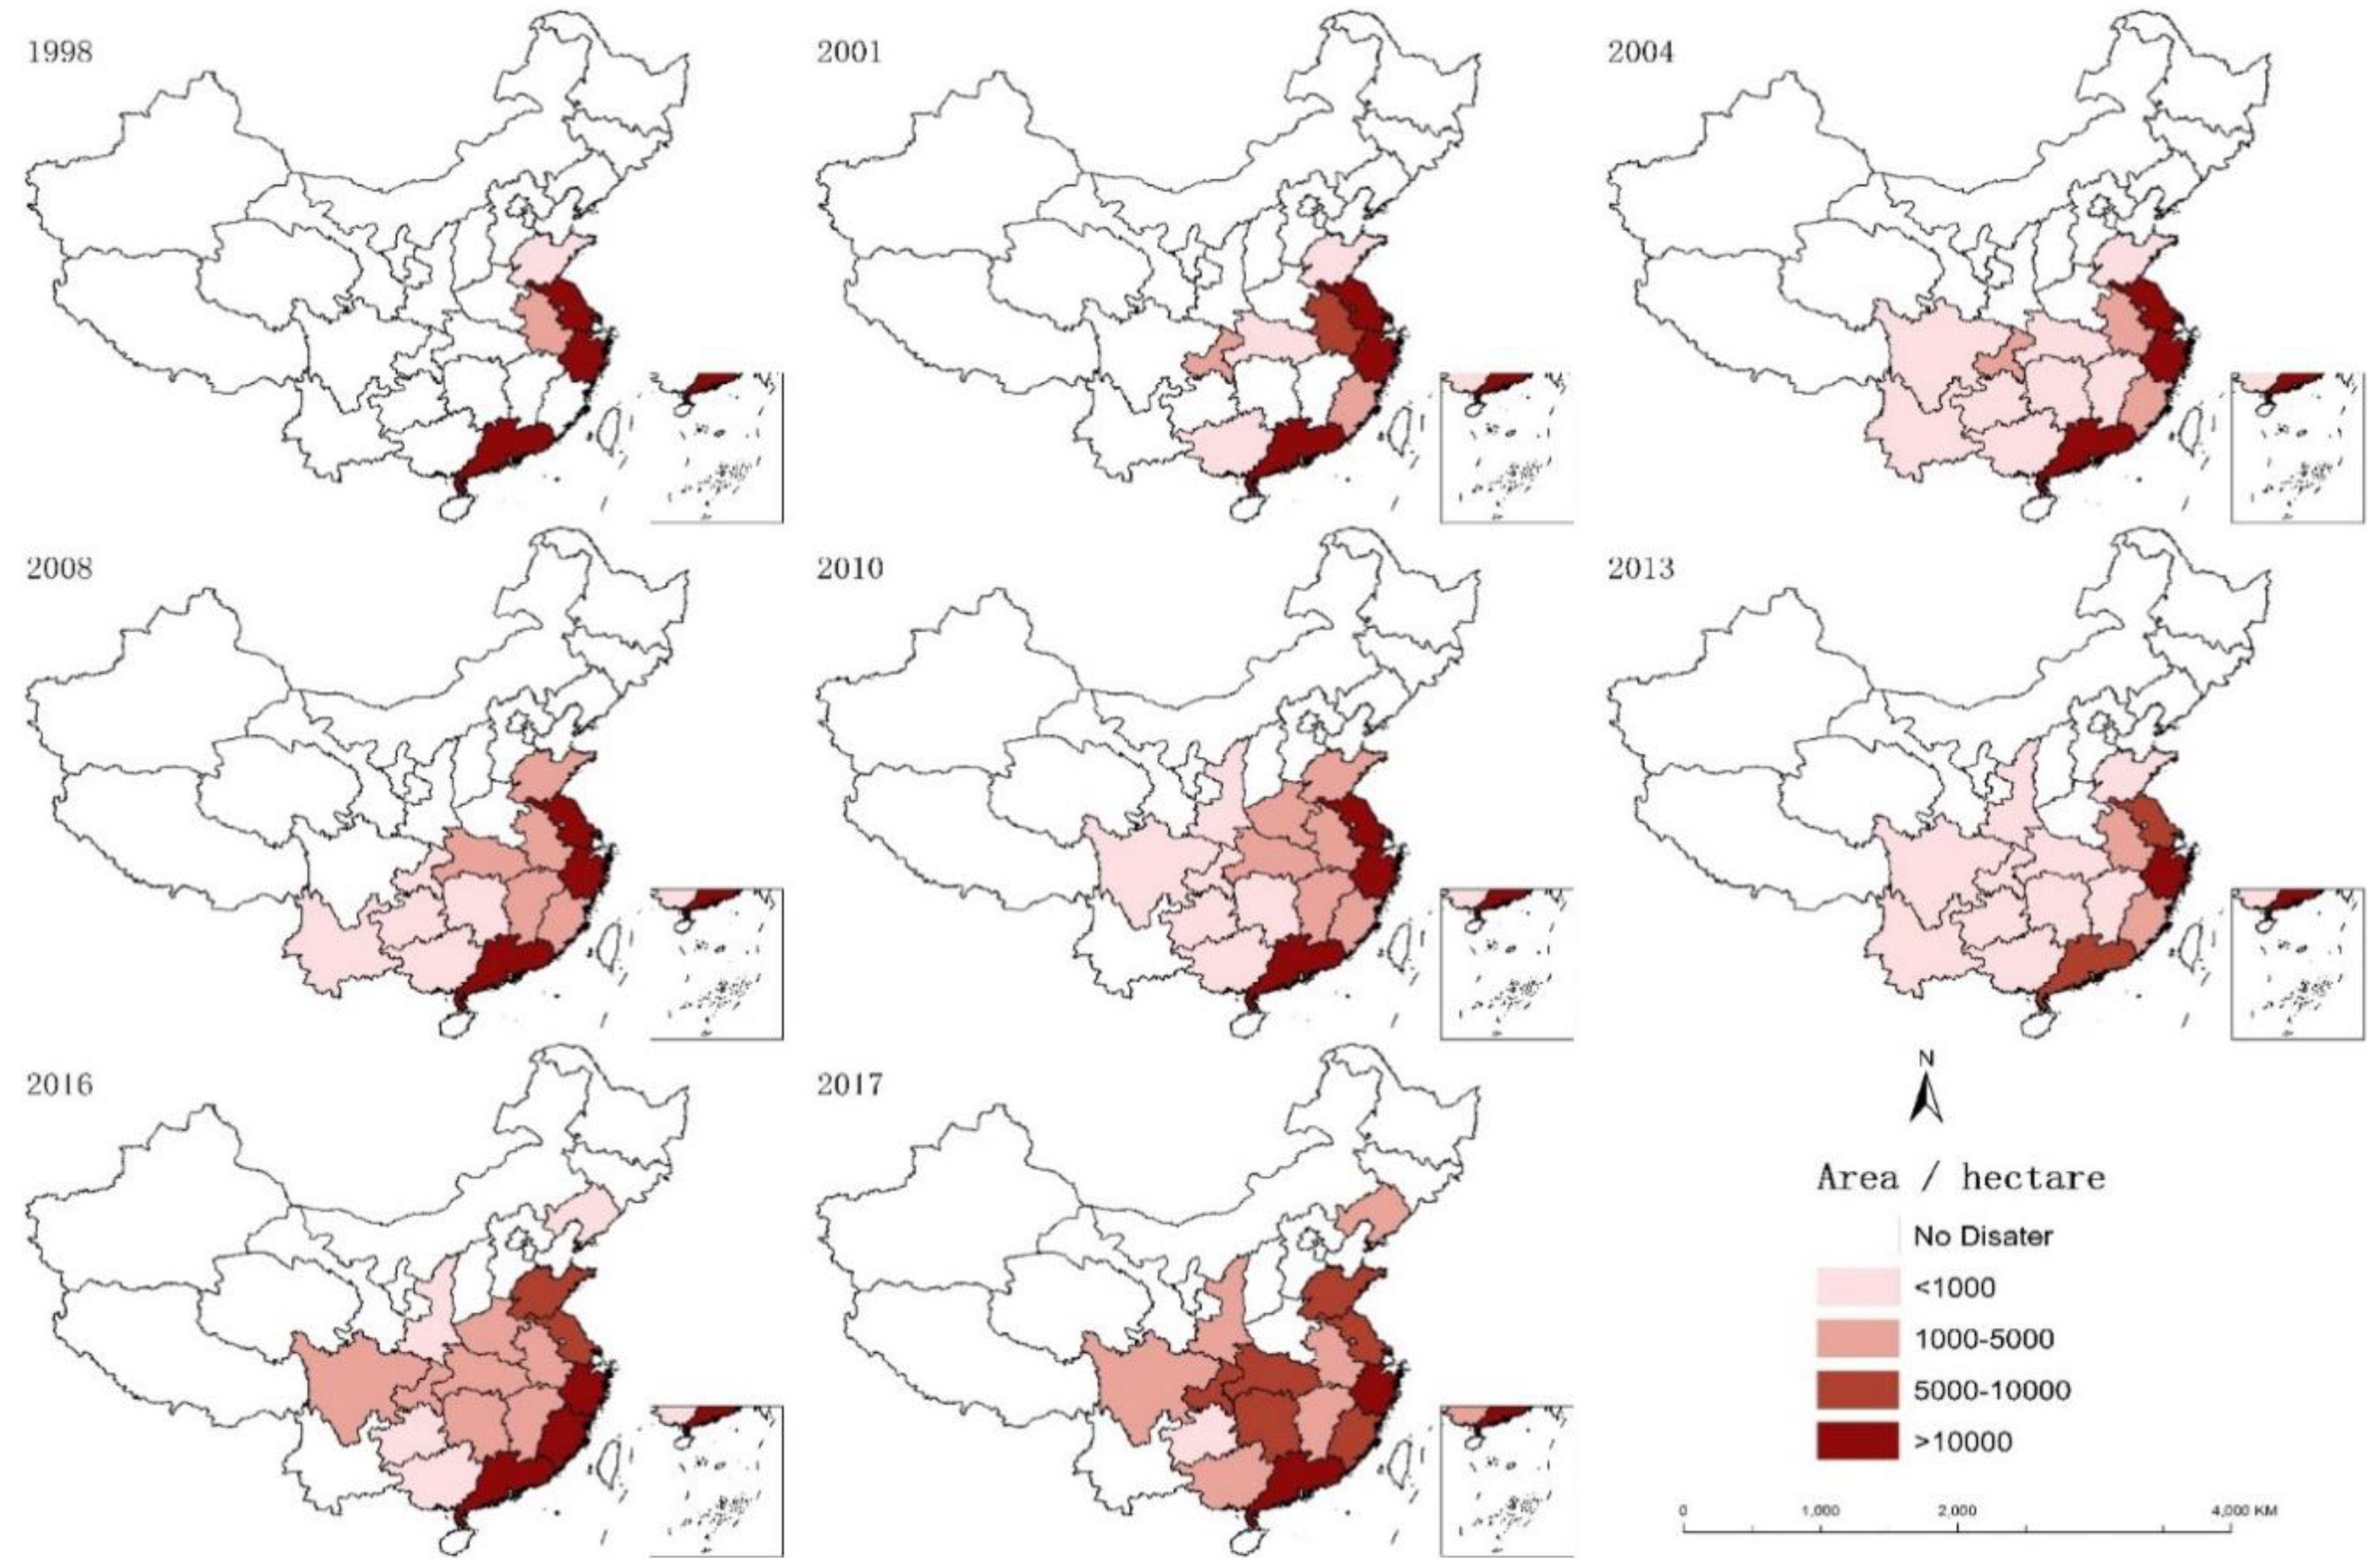
At the provincial level, in the past two decades, pine wood nematode disease has broken out in a total of 18 provinces in China, and the severity of pine wood nematode disease has varied among regions (Figure 2).
Jiangsu, Zhejiang, Anhui, Shandong and Guangdong Province have experienced pine wood nematode disease for 20 consecutive years. Henan, Guangxi, Sichuan, and Yunnan provinces got infected again after the epidemic area was successfully removed. Among them, the cumulative disease in Henan and Yunnan Provinces occurred for less than 10 years, and in Guangxi and Sichuan Provinces it occurred for more than 10 years. The pine wood nematode disease was discovered between 2000 and 2002 in Shanghai, and the epidemic area was successfully removed afterwards; Liaoning Province was the new epidemic area in 2016.
From the spatial perspective, the scale infected declined from the east to the west in general. The province with the most severe pine wood nematode disease is Zhejiang Province, with an average annual diseased area of 22,667 hectares, followed by Guangdong Province, with an average annual diseased area of 15,333 hectares, and Jiangsu Province, with average annual diseased area of 12,667 hectares. The other provinces all had diseased areas of less than 6667 hectares. The average annual area infected in Guangxi, Guizhou and Yunnan Province was less than 667 hectares, and the average annual area infected in Shanghai was only 16 hectares.
Overall, Zhejiang, Guangdong, Jiangsu, and Anhui provinces were the provinces most severely infected by pine wood nematode disease for 20 consecutive years, and the cumulative diseased area was greater than 66,667 hectares. Liaoning Province had an average annual area of 1594 hectares, and the disease spread rapidly. At the same time, due to the northeast forest farm and the high geographical latitude, Liaoning Province is the front line for the northward spread of pine wood nematode disease. Pine wood nematode disease has occurred in the southern region for 20 consecutive years, and the disease area has been increasing, and spreading rapidly to the north (Table A2).

3.2. The Economic Losses of Pine Wood Nematode Disease in Mainland China from 1998 to 2017

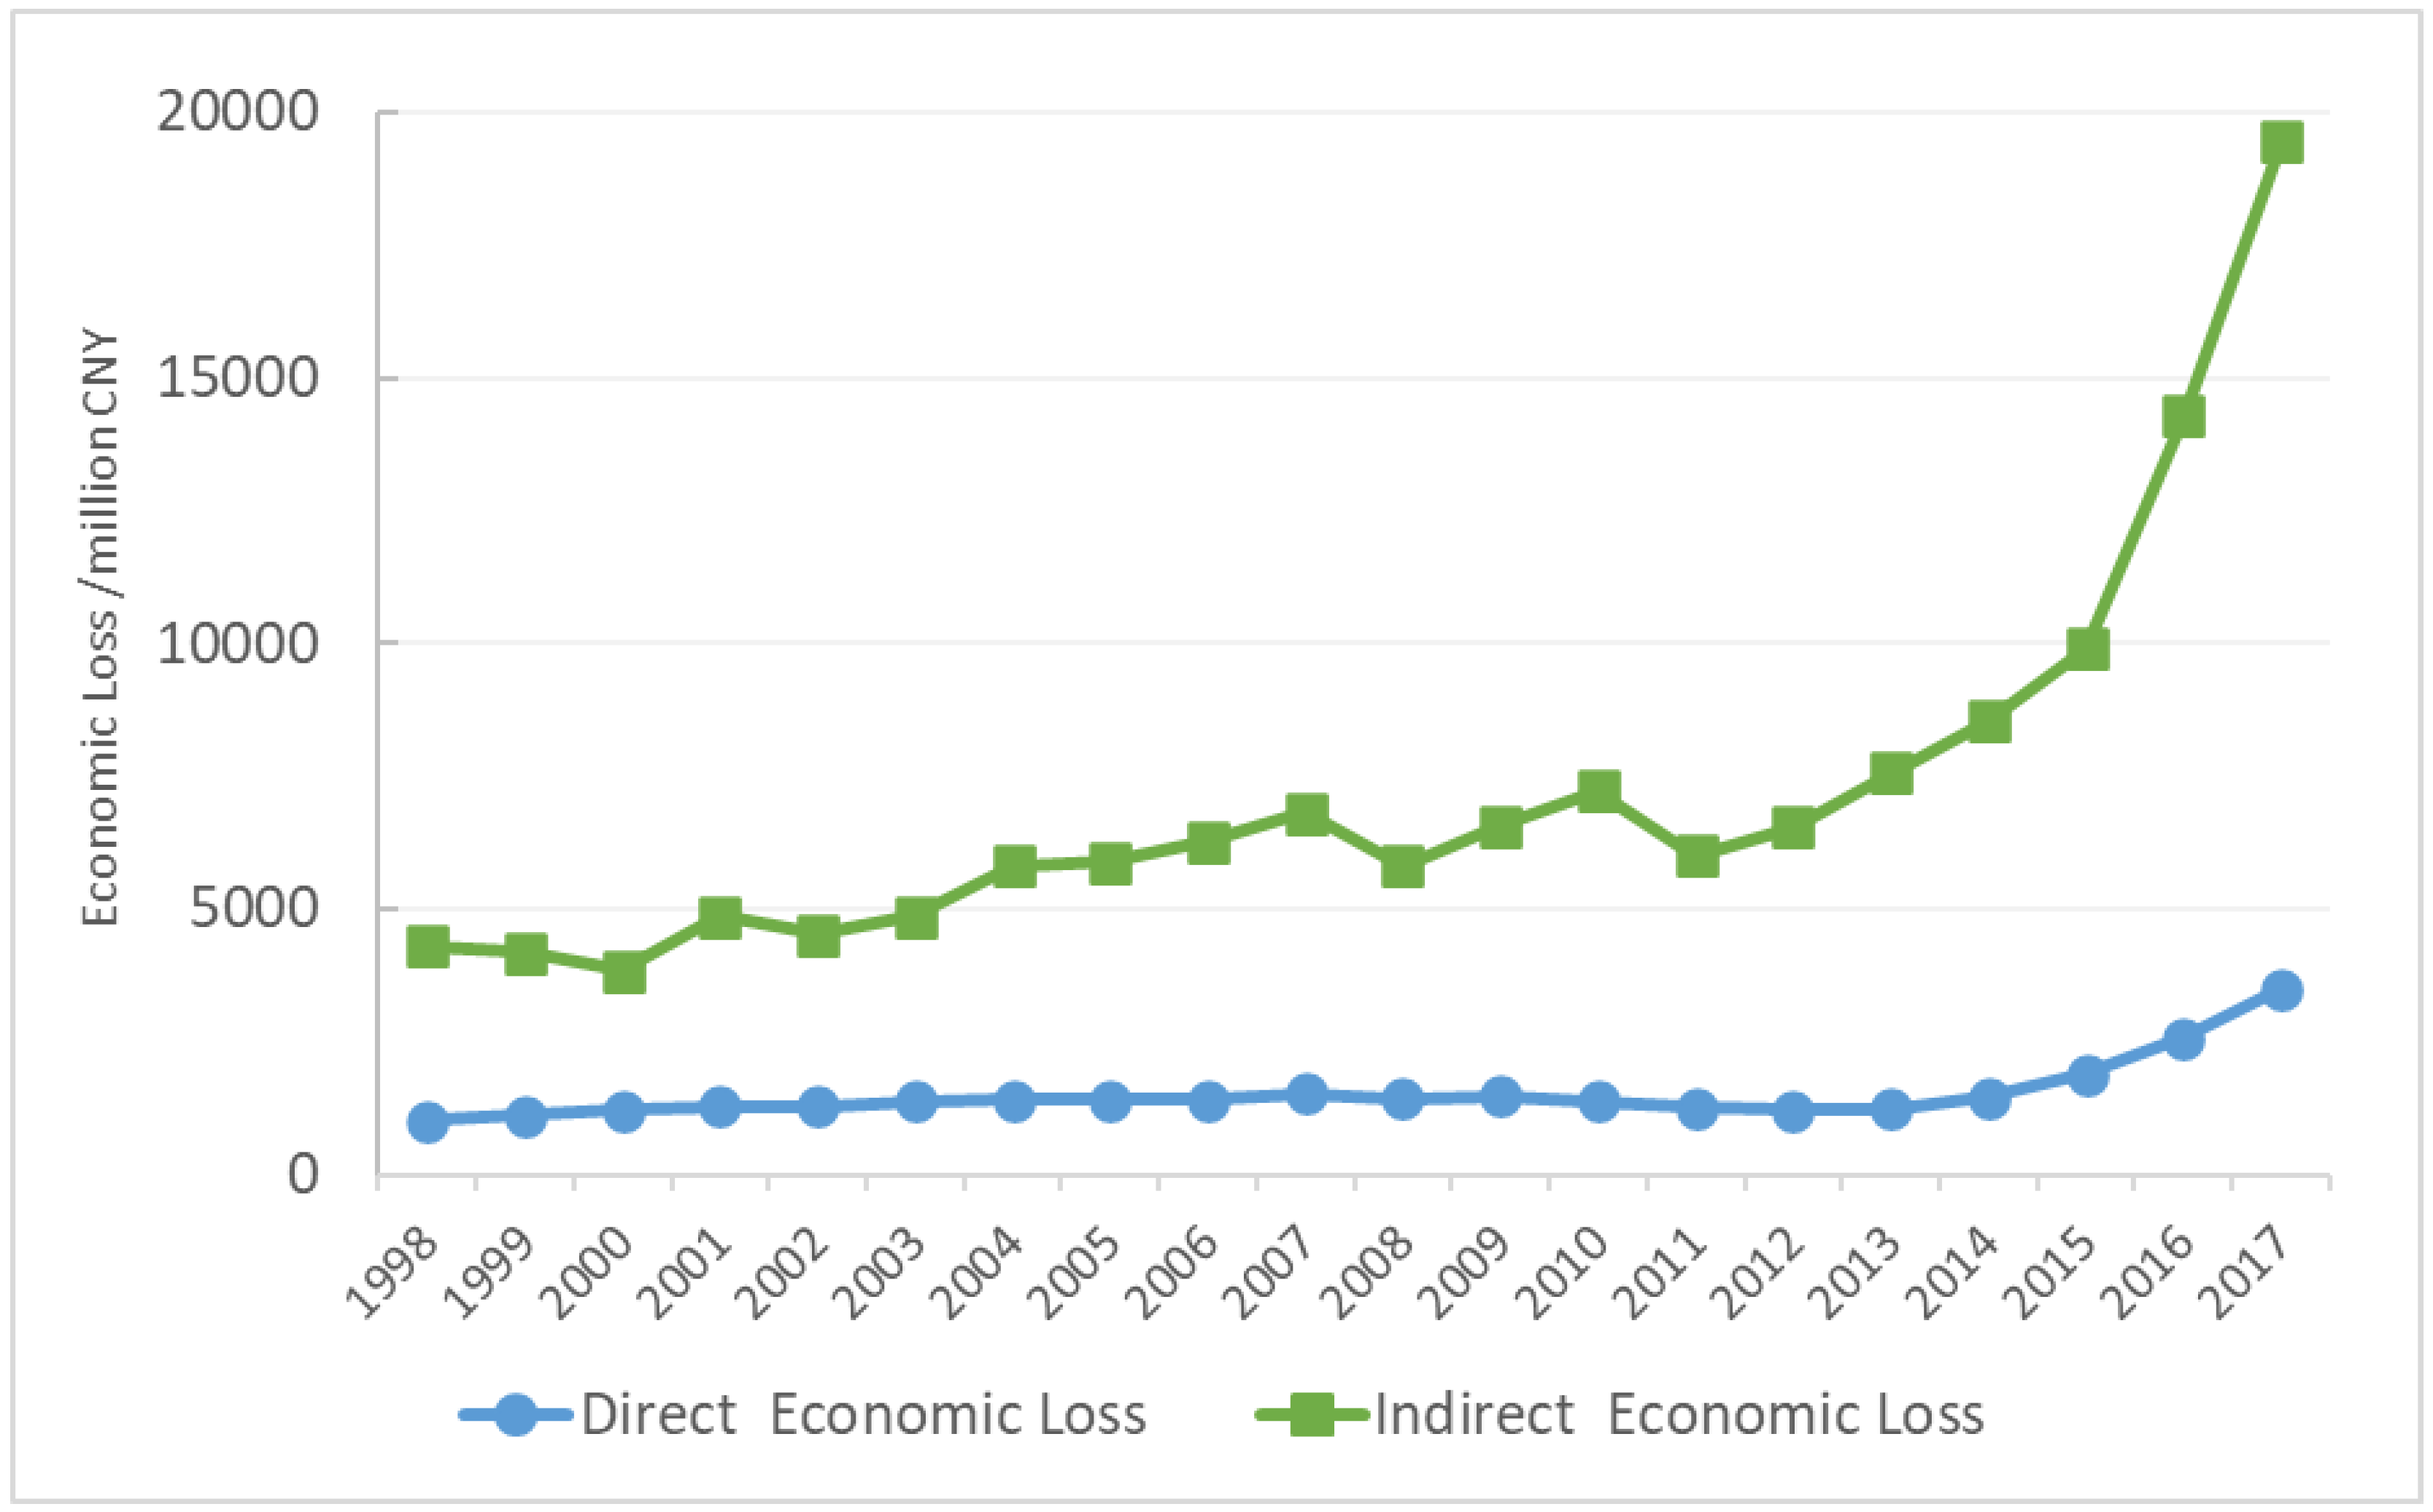
The economic losses caused by the pine wood nematode disease during the 20 years from 1998 to 2017 showed a rising trend. Here, 2008 can be seen as the watershed for the disease losses. The loss before 2008 was relatively small, except for 2001 and 2004. After 2008, the disease loss growth rate was higher than 10%, especially in 2016 and 2017, the disease loss growth rate reached 44.5% and 36.2%, respectively. The downward trend only occurred in 1999–2000, 2008, and 2011 during the 20 years (Figure 3).
From 1998 to 2017, the total economic loss of pine wood nematode disease was CNY 7.17 billion /year. The direct economic loss accounted for 21.4% of the total economic loss, and indirect economic loss accounted for 78.6% (Table A3). The direct economic losses were mainly the loss of forest material resources and ineffective expenditure for forestry management expenditure, with an average annual economic losses of more than CNY 800 and 600 million, accounting for 53% and 42% of the total direct economic loss, respectively. The average annual economic expenditure of prevention expenditure was less than CNY 100 million, accounting for 5% of direct economic losses (Table A4). Among the tertiary indicators, the main loss was the loss of forest by-products, with the average annual economic loss being more than CNY 770 million, accounting for 50% of direct economic loss. The loss of ineffective forestation was mainly the loss of afforestation expenditure, with the average annual economic loss of around CNY 540 million, accounting for 35% of direct economic loss (Table A5).
The indirect economic loss is mainly the loss of adjustment service value and the support service value, with the average annual economic losses being about CNY 4 and 1.4 billion, accounting for 70% and 25% of the total indirect economic loss (Table A6). Among the tertiary indicators, the losses of climate regulation services and hydrological regulation services were CNY 940 and 760 million, accounting for 30% and 21% of indirect economic losses, respectively. The average annual economic losses of gas regulation and purification environment were around CNY 320 and 280 million. The loss of support service value was mainly from soil conservation services, with the average annual economic loss of CNY 470 million, accounting for 13% of the indirect economic loss. The average annual economic loss of the biodiversity service value was CNY 350 million, accounting for less than 1% of indirect economic losses; the annual loss of aesthetic landscape service value was CNY 150 million, accounting for 5% of indirect economic losses (Table A7).

3.3. Economic Loss of Pine Wood Nematode Disease at Provincial Scale in Mainland China from 1998 to 2017

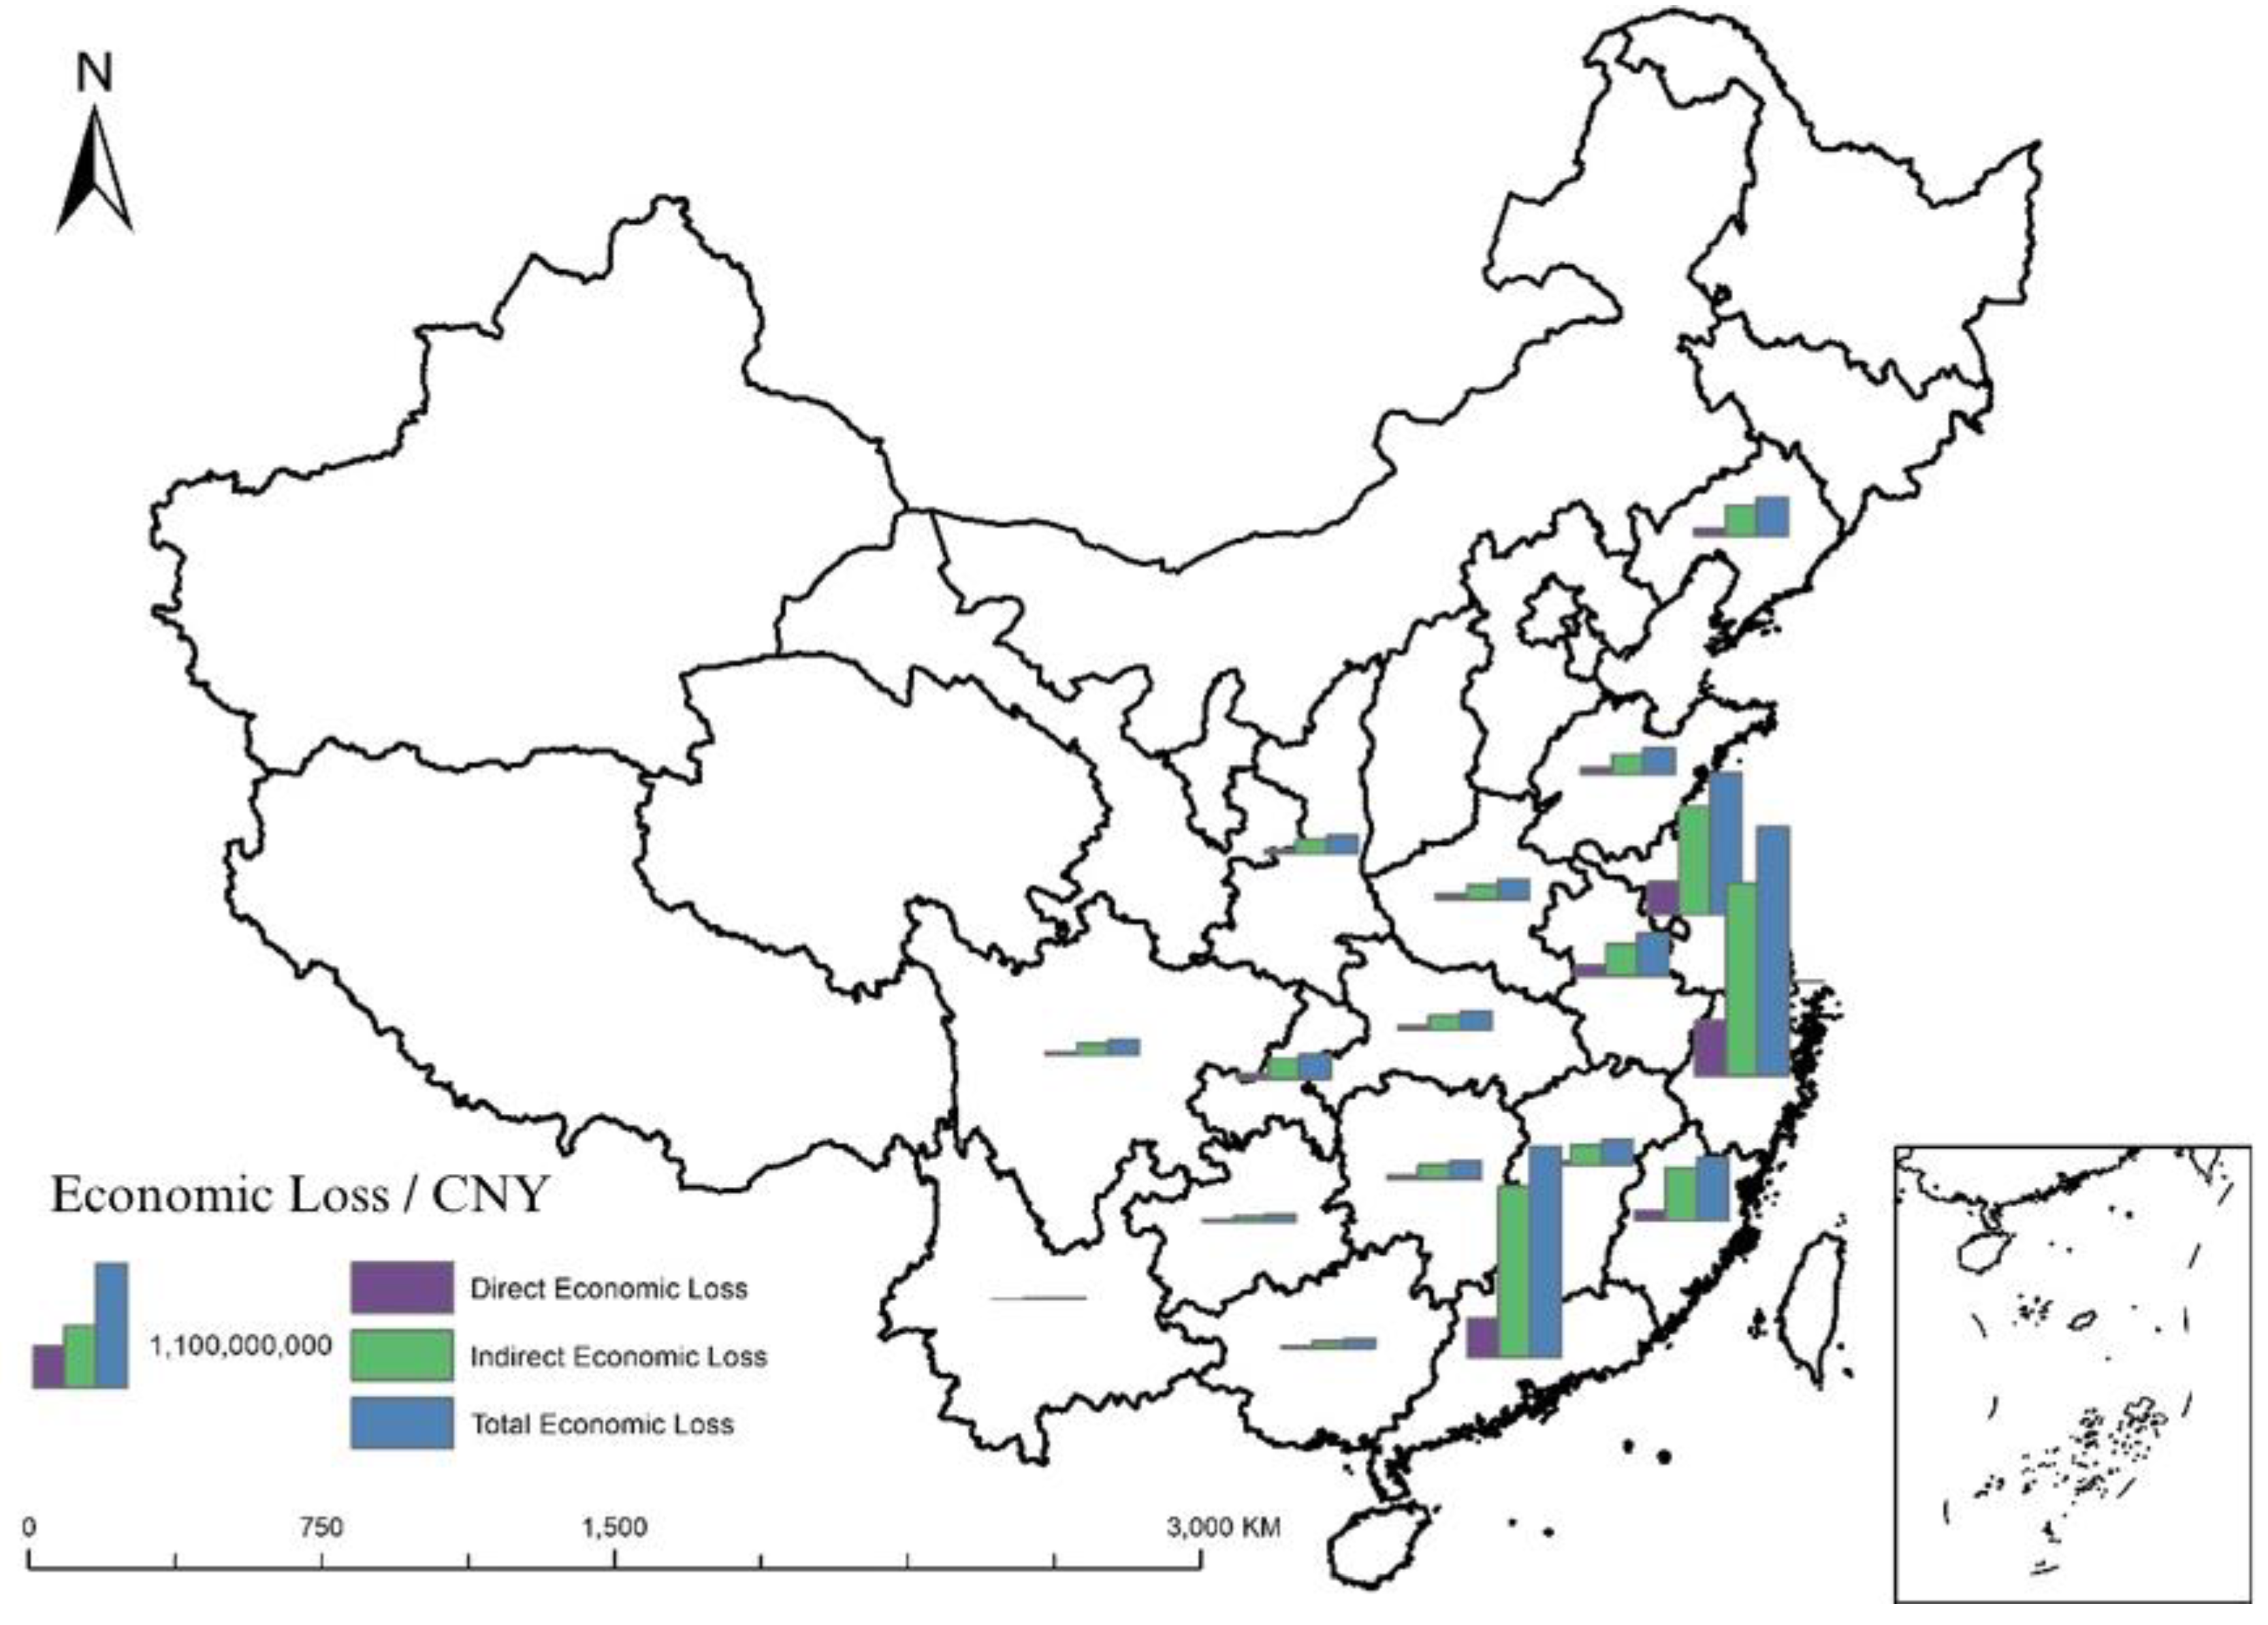
According to the evaluation, the economic losses of pine wood nematode disease in various provinces of China from 1998 to 2017 showed an upward trend. Zhejiang, Guangdong and Jiangsu provinces were the areas with the most severe economic losses in disease (Figure 4.). Zhejiang’s average annual economic loss was CNY 2.14 billion, accounting for 28% of the national economic loss, of which direct economic loss was CNY 480 million and indirect economic loss was CNY 1.66 billion. The average annual economic loss in Guangdong Province was CNY 1.81 billion, accounting for 23% of the national economic loss. The average annual economic loss in Jiangsu Province was CNY 1.22 billion, accounting for 15% of the national economic loss, of which the direct economic losses accounted for 3%, and indirect economic losses accounted for 12% (Table A8).
The economic loss of the pine wood nematode disease also showed a decreasing trend from the east to the west. The average annual economic loss in Fujian Province was CNY 550 million, followed by Jiangsu Province. In addition, Anhui Province, Liaoning Province, Shandong Province, Jiangxi Province, and Chongqing Municipality also suffered huge losses, and the average annual economic loss was more than CNY 200 million. Among them, except for Chongqing and Liaoning Provinces, the other provinces are located in the southeast of China. Regarding Liaoning Province, although it was a new epidemic area in 2016, its annual economic loss was CNY 320 million, accounting for 4% of the national average annual economic loss of pine wood nematode disease.
Zhejiang, Guangdong, Jiangsu, Anhui, and Fujian suffered the most in terms of direct economic loss. Among them, Zhejiang Province lost CNY 480 million, Guangdong Province lost CNY 340 million and Jiangsu Province lost CNY 280 million, accounting for 29.8%, 25.3%, and 17.0% of the national economic loss. Yunnan Province lost CNY 3.25 million in economic loss, Shanghai lost CNY 250,000, and the losses of others were greater than CNY 10 million and less than CNY 100 million (Table A9). Zhejiang, Guangdong, Jiangsu, Fujian and Anhui suffered the most in terms of indirect loss (Table A10).
In general, the indirect economic losses were greater than the direct economic losses. Fujian, Guangxi, and Guangdong Province were the regions with the largest ratios of indirect economic losses against direct economic losses, which were 4.9, 4.5, and 4.4, respectively. The regions with the smallest ratios of indirect economic losses to direct economic losses were Shanghai, Henan and Anhui province, the values for which were 1.2, 2.6, and 2.9.

4. Discussion

The pine wood nematode disease in China has continuously expanded since 1998. Due to global warming, the suitable range of pine wood nematodes has continued to expand, and new vector insects and susceptible tree species have been developed in the process. In 2012, pine wood nematode disease was found in Tianzhushan Forest Park, with an annual average temperature of only 7.9 °C, in Shanyang County, Shaanxi Province, at an altitude of 1700–1800 m. For the first time, Pinus armandii Franch was identified as a natural susceptible tree species for pine wood nematodes [54]; for the first time in 2016, the Monochamussaltuarius Gebler was confirmed to be a transmission vector of pine wood nematodes, and Korean pine is another new host of Chinese pine wood nematodes [55].
The number pine wood nematode outbreaks in China is soaring, and human activity is an important factor affecting the spread rate and scale of pine wood nematode disease [56]. Coastal cities such as Shantou City in Guangdong Province and Dalian City in Liaoning Province became the first portals in the province infected and spread inward, indicating that the long-term expansion of pine wood nematodes is due to the transportation of pine wood nematode logs [25], as sea transportation played a huge role in transportation. In addition, Henan and Guangxi Zhuang Autonomous Regions have relapsed after the epidemic area was successfully eliminated, which may be due to the fact that the two provinces have planted horsetail pines and black pines with different degrees of latent infection [57]. Pine wood nematode disease has an incubation period, which cannot be detected and treated in time, leading to re-spread. The original technology of Yunnan Province to use Poria cocos for the harmless treatment of pine wood nematode disease has made outstanding contributions to the effective control of pine wood nematode disease. In 2004, after the first discovery of pine wood nematode disease in Ruili City, the area of the disease continued decreasing, and the affected area was finally removed within 5 years. After that, the disease was discovered again in 2013. However, due to the small area of the disease, the treatment was quickly successful.
From 1998 to 2017, the economic losses of the pine wood nematode disease in China showed regional disparities, and the southeast region was the worst-hit area for disease economic losses. On the one hand, due to the long outbreak and large disease area in the southeast region, the pine wood nematode disease occurred in Jiangsu, Anhui, Shandong, Zhejiang and Guangdong provinces for 20 consecutive years, and the scale of the disease is expanding. On the other hand, the quality of forest resources in southern China is high, and pine forests are widely distributed. Especially in Guangdong, where there is sufficient rainfall and suitable climate conditions, the forest ecosystem per unit area has high value, so the losses are huge. In addition, Liaoning Province is located in the northeast forest farm, and pine wood nematodes have developed new hosts and new vector insects here, so they spread very quickly. The area of disease increased 10 times within a year, and economic losses increased rapidly.
In this study, a long-term series of dynamic evaluation was achieved using the forestry output value index and dynamic equivalent factor method. The forestry output value index is a continuity index that reflects the inter-annual changes in forestry production. Using this index, the calculation parameters and evaluation results can be converted and discounted to the currency level of the current year to achieve a dynamic evaluation of direct economic losses. The dynamic equivalence factor uses different inter-annual food prices to construct standard equivalents, uses development stage coefficients to reflect inter-annual changes in people’s willingness to pay, and finally uses rainfall and GPP data to reflect the value of services of forest ecosystem. It not only can achieve dynamic evaluation at temporal resolution, but dynamic evaluation at spatial resolution can also be achieved.
In order to achieve quantitative evaluation, the evaluation index system constructed in this study is relatively simple and practical. We choose turpentine as the main forest by-product to assess the value of its loss due to the data accessibility, though there are a variety of forest by-products of pine trees, considering the practical difficulties in data collection. To some extent, this will lead to a lower assessment result.
Although the content of the evaluation of indirect economic losses is basically the same as the value of ecosystem services, evaluation scopes [50] and the choice of methods [58] are different. Forest types [59] and site conditions [60], are also adapted to local conditions. In addition, the evaluation results obtained in this study are based on the currency level in the year of the disease. Due to inflation and other reasons, compared with the results released by the China National Forestry Administration [26], our evaluation results are relatively smaller, and the overall gap is not large.
This study builds a highly practical pine wood nematode disease economic loss evaluation system, and quantitatively calculates the economic losses of China’s pine wood nematode disease from 1998 to 2017, which fills the gap in the quantitative assessment of economic losses caused by pine wood nematode diseases in long-term series. Economic loss evaluation is not only an important part of natural resource and environmental value accounting, but also an essential basis for formulating disease prevention and control programs and an important basis for evaluating the effectiveness of disease control. With the continuous expansion of pine wood nematode disease, evaluation of the loss of value of pine wood nematode forest ecosystem services has practical significance for people to strengthen environmental protection awareness, improve forest management, and scientifically invest in forestry production.
This study also has the following limitations: (1) default individual parameters. Although the quantitative evaluation index system constructed in this study is based on practicability, due to the difficulty of data collection, there are still problems with the default parameters of individual revisions in practical applications. Our solution is to use the trend function for prediction, so it is possible to have some impact on the results. (2) Underestimate cultural value. Although this study included the cultural service value of forest ecosystems in the evaluation index system, more and more studies have proved that the cultural value of ecosystems has been largely ignored in the past [61], and many of the cultural services of ecosystems are important aspects that have not yet achieved satisfactory research progress [62]. (3) Substitute faces with points. Most of the parameters used in the quantitative calculation process are collected from different literatures, and these data are mostly sample survey data, which is not representative to a certain extent.

5. Conclusions

This study aims to quantitatively evaluate the economic losses from disease caused by pine wood nematode in mainland China from 1998 to 2017. The occurrence and prevalence of pine wood nematodes have brought huge impacts on China’s ecological environment and economy and society. By constructing a three-level index system including direct economic loss and indirect economic loss, and comprehensively applying the direct market method and the dynamic equivalent factor method, this study quantitatively evaluates of the economic losses caused by pine wood nematode disease in various provinces in mainland China from 1998 to 2017.
In general, the economic losses of pine wood nematode disease have increased since 1998, and have become more huge from 2015 to 2017. The indirect economic losses were far greater than the direct economic losses. From a spatial point of view, the economic losses caused by disease in the southeast region were more serious.

Author Contributions

Conceptualization, J.H. and G.F.; Data curation, J.Z.; Methodology, J.Z. and J.H.; Project administration, J.H. and G.F.; Resources, J.Y. and G.F.; Writing—original draft, J.Z.; Writing—review and editing, J.Z., and J.H. All authors have read and agreed to the published version of the manuscript.

Funding

This research was funded by the National Key Research and Development Program of China [grant numbers 2018YFC1200400, 2019YFA0606600]; the National Science and Technology Major Project [grant number No.21-Y30B02-9001-19/22].

Conflicts of Interest

The authors declare no conflict of interest.

Appendix A

Table A1. Occurrence area of pine wood nematode disease in China from 1998 to 2017/ha.
StageYearOccurrence AreaIncreaseCumulative Occurrence Area
The first stage199872,726.670.0%72,726.67
199976,646.675.4%149,373.33
200078,846.672.9%228,220.00
200184,686.677.4%312,906.67
The second stage200278,993.33−6.7%391,900.00
200379,553.330.7%471,453.33
200478,640.00−1.2%550,093.33
200576,666.67−2.5%626,760.00
200671,180.00−7.2%697,933.33
200771,060.00−0.2%768,993.33
200863,166.67−11.1%832,166.67
200960,893.33−3.6%893,060.00
201053,273.33−12.5%946,333.33
201145,166.67−15.2%991,500.00
201240,793.33−9.7%1,032,286.67
201338,360.00−6.0%1,070,646.67
The third stage201443,193.3312.6%1,113,840.00
201552,813.3322.3%1,166,660.00
201662,153.3317.7%1,228,813.33
201785,026.6736.8%1,313,833.33
Table A2. The area of disease in provinces of mainland China from 1998 to 2017/ha.
Provincial Administrative RegionCumulative TimeAnnual Average AreaCumulative Occurrence Area
Liaoning21593.833187.65
Shanghai315.5646.67
Jiangsu2012,522.21250,444.13
Zhejiang2022,636.52452,730.40
Anhui204537.5090,749.99
Fujian173244.2155,151.60
Jiangxi151584.8723,772.99
Shandong201636.2032,723.93
Henan61538.599231.53
Hubei181308.5523,553.87
Hunan15979.0714,686.03
Guangdong2015,191.72303,834.33
Guangxi16536.228579.52
Chongqing171506.7825,615.33
Sichuan12743.408920.77
Guizhou15526.107891.49
Yunnan6168.081008.49
Shaanxi9920.968288.67
Table A3. Economic losses from disease in mainland China from 1998 to 2017/104 CNY.
YearDirect Economic LossIndirect Economic LossTotal Economic Loss
1998103,493.95328,544.88432,038.82
1999112,564.96306,599.72419,164.69
2000122,044.97263,691.11385,736.07
2001130,172.13357,823.77487,995.90
2002130,040.58323,793.96453,834.54
2003139,999.52347,281.54487,281.06
2004141,156.19441,654.40582,810.59
2005142,016.80447,094.68589,111.48
2006142,548.91485,578.00628,126.91
2007152,698.56530,288.34682,986.90
2008144,281.12438,529.53582,810.65
2009148,960.83507,575.62656,536.44
2010138,789.11585,091.62723,880.73
2011126,614.47474,668.68601,283.16
2012121,994.92533,612.43655,607.35
2013123,470.25633,026.27756,496.52
2014147,078.50707,329.24854,407.74
2015189,703.01800,248.20989,951.21
2016258,043.721,172,250.271,430,293.99
2017349,672.461,598,169.591,947,842.05
Table A4. Direct economic losses from disease in Mainland China from 1998 to 2017 (Secondary indicators)/104 CNY.
YearDirect Economic LossLoss of Forest Material ResourcesLoss of Prevention and Control ExpenditureIneffective Forestry Expenditure
1998103,493.9555,182.914514.5343,796.50
1999112,564.9660,019.584910.2247,635.17
2000122,044.9765,074.315323.7551,646.91
2001130,172.1369,407.705678.2655,086.16
2002130,040.5869,337.575672.5355,030.49
2003139,999.5274,647.666106.9559,244.91
2004141,156.1975,264.406157.4059,734.39
2005142,016.8075,723.286194.9460,098.58
2006142,548.9176,007.006218.1560,323.76
2007152,698.5681,418.796660.8964,618.88
2008144,281.1276,930.616293.7261,056.79
2009148,960.8379,425.836497.8563,037.15
2010138,789.1174,002.286054.1558,732.69
2011126,614.4767,510.775523.0853,580.63
2012121,994.9265,047.625321.5651,625.73
2013123,470.2565,834.275385.9252,250.06
2014147,078.5078,422.176415.7462,240.58
2015189,703.01101,149.548275.0780,278.40
2016258,043.72137,588.7711,256.18109,198.78
2017349,672.46186,445.1615,253.13147,974.17
Table A5. Direct economic losses from disease in Mainland China from 1998 to 2017 (Tertiary indicator)/104 CNY.
YearForest VolumeForest By-ProductsPrevention and ControlAfforestation ExpenditureTending ExpenditureMaintenance Expenditure
19983065.8852,117.034514.5336,179.984425.243191.28
19993334.6056,684.984910.2239,351.084813.103470.99
20003615.4361,458.885323.7542,665.155218.453763.31
20013856.1965,551.525678.2645,506.295565.964013.91
20023852.2965,485.285672.5345,460.305560.334009.86
20034147.3170,500.356106.9548,941.805986.164316.94
20044181.5871,082.826157.4049,346.166035.624352.61
20054207.0771,516.216194.9449,647.026072.424379.15
20064222.8371,784.166218.1549,833.036095.174395.55
20074523.5176,895.286660.8953,381.206529.154708.52
20084274.1572,656.466293.7250,438.596169.244448.97
20094412.7875,013.056497.8552,074.556369.334593.27
20104111.4669,890.826054.1548,518.665934.414279.62
20113750.8063,759.975523.0844,262.585413.843904.21
20123613.9561,433.675321.5642,647.665216.313761.76
20133657.6562,176.615385.9243,163.415279.403807.26
20144357.0274,065.156415.7451,416.516288.854535.23
20155619.7295,529.828275.0766,317.428111.415849.57
20167644.23129,944.5411,256.1890,208.3511,033.557956.89
201710,358.61176,086.5415,253.13122,240.4214,951.4510,782.30
Table A6. Indirect economic losses from disease in Mainland China from 1998 to 2017 (Secondary indicators)/104 CNY.
YearIndirect Economic LossAdjustment Service Value LossSupport Service Value LossCultural Service Value Loss
1998328,544.88228,867.8384,454.6215,222.43
1999306,599.72215,179.5676,265.8315,154.33
2000263,691.11187,885.7861,098.3714,706.96
2001357,823.77249,766.7991,179.5616,877.42
2002323,793.96224,446.0185,005.5614,342.38
2003347,281.54245,754.7183,161.0818,365.74
2004441,654.40309,342.74110,850.8221,460.84
2005447,094.68314,030.62110,818.2822,245.78
2006485,578.00339,407.75122,990.3123,179.94
2007530,288.34368,281.46138,103.3823,903.50
2008438,529.53308,535.79107,864.9222,128.82
2009507,575.62355,746.14127,028.3524,801.13
2010585,091.62406,605.71151,955.5826,530.33
2011474,668.68338,491.97109,536.6926,640.03
2012533,612.43377,039.49128,693.0627,879.88
2013633,026.27447,673.20152,047.7033,305.36
2014707,329.24498,151.12173,190.9135,987.22
2015800,248.20562,121.79198,283.5239,842.89
20161,172,250.27810,213.10311,514.0050,523.18
20171,598,169.591,119,970.02400,195.4578,004.12
Table A7. Indirect economic losses from disease in Mainland China from 1998 to 2017 (Tertiary indicator)/104 CNY.
YearGasClimatePurificationHydrologicalSoilNutrientBiodiversityAesthetic
199831,558.6994,119.1727,660.2775,529.7046,584.192970.2334,900.2015,222.43
199931,417.5193,698.1127,536.5362,527.4138,564.812956.9434,744.0715,154.33
200030,490.0590,932.0826,723.6339,740.0224,510.312869.6533,718.4114,706.96
200134,989.78104,351.8830,667.5179,757.6149,191.823293.1638,694.5816,877.42
200229,734.2088,677.8926,061.1679,972.7649,324.522798.5132,882.5314,342.38
200338,075.32113,554.0333,371.9060,753.4737,470.703583.5642,106.8218,365.74
200444,491.99132,690.8238,995.9293,164.0157,460.444187.4849,202.9121,460.84
200546,119.29137,544.0140,422.2089,945.1255,475.134340.6451,002.5122,245.78
200648,055.97143,319.8542,119.64105,912.2965,323.154522.9153,144.2523,179.94
200749,556.04147,793.6043,434.41127,497.4178,636.134664.1054,803.1523,903.50
200845,876.82136,820.8740,209.6885,628.4152,812.734317.8250,734.3722,128.82
200951,416.98153,343.5745,065.47105,920.1265,327.984839.2456,861.1324,801.13
201055,001.90164,035.0948,207.55139,361.1785,953.305176.6560,825.6326,530.33
201155,229.32164,713.3348,406.8870,142.4443,261.505198.0561,077.1326,640.03
201257,799.76172,379.2850,659.7996,200.6759,333.355439.9863,919.7327,879.88
201369,047.71205,924.6360,518.28112,182.5969,190.466498.6176,358.6433,305.36
201474,607.65222,506.3465,391.41135,645.7183,661.737021.9082,507.2835,987.22
201582,601.12246,345.7072,397.45160,777.5199,162.187774.2291,347.1239,842.89
2016104,743.17312,381.1091,804.31301,284.53185,822.199858.18115,833.6250,523.18
2017161,715.86482,293.78141,739.20334,221.17206,136.4115,220.32178,838.7278,004.12
Table A8. Economic losses on the provincial level in mainland China from 1998 to 2017/104 yuan.
Provincial Administrative RegionDirect Economic LossIndirect Economic LossTotal Economic Loss
Liaoning6480.3325,901.4332,381.77
Shanghai24.4730.0054.47
Jiangsu28,329.4193,449.93121,779.34
Zhejiang47,973.59166,006.08213,979.66
Anhui9524.9427,400.7336,925.67
Fujian9344.6045,662.5055,007.11
Jiangxi4434.3217,584.8422,019.16
Shandong5333.7116,857.7922,191.50
Henan4751.5612,498.5517,250.11
Hubei3804.2212,257.1116,061.32
Hunan3255.1012,033.1515,288.25
Guangdong33,755.87147,365.69181,121.56
Guangxi1347.406128.887476.29
Chongqing4452.8517,290.8621,743.71
Sichuan2758.929862.3812,621.30
Guizhou1337.604440.665778.26
Yunnan324.90983.641308.54
Shaanxi3377.6012,259.5415,637.15
Table A9. Direct economic losses on the provincial level in Mainland China from 1998 to 2017 (Secondary indicators)/104 CNY.
Provincial Administrative RegionDirect Economic LossLoss of Forest Material ResourcesLoss of Prevention and Control ExpenditureIneffective Forestry Expenditure
Liaoning6480.333455.31282.682742.34
Shanghai24.4713.051.0710.35
Jiangsu28,329.4115,105.221235.7611,988.42
Zhejiang47,973.5925,579.492092.6720,301.43
Anhui9524.945078.69415.494030.76
Fujian9344.604982.54407.623954.44
Jiangxi4434.322364.38193.431876.51
Shandong5333.712843.93232.662257.11
Henan4751.562533.53207.272010.76
Hubei3804.222028.41165.941609.87
Hunan3255.101735.62141.991377.49
Guangdong33,755.8717,998.611472.4714,284.79
Guangxi1347.40718.4358.78570.19
Chongqing4452.852374.26194.241884.35
Sichuan2758.921471.06120.351167.52
Guizhou1337.60713.2158.35566.05
Yunnan324.90173.2414.17137.49
Shaanxi3377.601800.94147.341429.33
Table A10. Indirect economic losses on the provincial level in Mainland China from 1998 to 2017 (Secondary indicators)/104 CNY.
Provincial Administrative RegionIndirect Economic LossAdjustment Service Value LossSupport Service Value LossCultural Service Value Loss
Liaoning25,901.4315,881.758443.051576.64
Shanghai30.0014.7313.811.46
Jiangsu93,449.9349,815.4138,689.174945.36
Zhejiang166,006.0876,823.5681,555.977626.55
Anhui27,400.7314,248.1211,738.151414.46
Fujian45,662.5020,415.1223,220.702026.68
Jiangxi17,584.849643.936983.52957.39
Shandong16,857.7910,269.075569.271019.45
Henan12,498.556917.644894.16686.74
Hubei12,257.116383.035240.42633.67
Hunan12,033.156492.144896.51644.50
Guangdong147,365.6971,790.3168,448.507126.88
Guangxi6128.883252.682553.30322.91
Chongqing17,290.867705.828820.05764.98
Sichuan9862.383894.245581.55386.60
Guizhou4440.662337.511871.10232.05
Yunnan983.64474.55461.9847.11
Shaanxi12,259.545269.936466.45523.16

References

  1. Montagné-Huck, C.; Brunette, M. Economic analysis of natural forest disturbances: A century of research. J. For. Econ. 2018, 32, 42–71. [Google Scholar] [CrossRef]
  2. Yemshanov, D.; Mckenney, D.W.; Groot, P.D.; Haugen, D.; Sidders, D.; Joss, B. A bioeconomic approach to assess the impact of an alien invasive insect on timber supply and harvesting: A case study with Sirexnoctilio in eastern Canada. Can. J. For. Res. 2009, 39, 154–168. [Google Scholar] [CrossRef]
  3. Chang, W.Y.; Lantz, V.A.; Hennigar, C.R.; Maclean, D.A. Economic impacts of forest pests: A case study of spruce budworm outbreaks and control in New Brunswick, Canada. Can. J. For. Res. 2012, 42, 490–505. [Google Scholar] [CrossRef]
  4. Kent, K.; Tomá, V.; Haight, R.G.; Arwin, P.; Cunniffe, N.J.; Gilligan, C.A.; Meentemeyer, R.K. Predicting the economic costs and property value losses attributed to sudden oak death damage in California (2010–2020). J. Environ. Manag. 2011, 92, 1292–1302. [Google Scholar]
  5. Sydnor, T.D.; Bumgardner, M.; Todd, A. The potential economic impacts of emerald ash borer (Agrilusplanipennis) on Ohio, US, communities. Arboric. Urban For. 2007, 33, 48–54. [Google Scholar]
  6. Bigsby, K.M.; Ambrose, M.J.; Tobin, P.C.; Sills, E.O. The cost of gypsy moth sex in the city. Urban For. Urban Green. 2014, 13, 459–468. [Google Scholar] [CrossRef]
  7. Van Lierop, P.; Lindquist, E.; Sathyapala, S.; Franceschini, G. Global forest area disturbance from fire, insect pests, diseases and severe weather events. For. Ecol. Manag. 2015, 352, 78–88. [Google Scholar] [CrossRef] [Green Version]
  8. Su, H.-J.; Zhao, J.; You, K.-D.; Chang, G.-B.; Chai, S.-Q.; Qu, T. Evaluation of economic losses caused by forest pests disasters in China. For. Pest Dis. 2004, 5, 16. [Google Scholar]
  9. Song, S.-Y.; Su, H.-J.; Yu, H.-Y.; Qu, T.; Chang, G.-B.; Zhao, J. Evaluation of economic losses caused by forest pest disasters between 2006 and 2010 in China. For. Pest Dis. 2011, 30, 1–4, 24. [Google Scholar]
  10. Yan, J. Economic Analysis and Countermeasures of Forestry Biological Disaster Management in China. Ph.D. Thesis, Beijing Forestry University, Beijing, China, 2008. [Google Scholar]
  11. Wang, X.-Z.; Cao, Y.-F.; Wang, L.-F.; Piao, C.-G.; Li, C.-L. Current status of pine wilt disease and its control status. J. Environ. Entomol. 2018, 40, 256–267. [Google Scholar]
  12. Kwon, T.-S.; Shin, J.H.; Lim, J.-H.; Kim, Y.-K.; Lee, E.J. Management of pine wilt disease in Korea through preventative silvicultural control. For. Ecol. Manag. 2011, 261, 562–569. [Google Scholar] [CrossRef]
  13. Lee, K.S.; Kim, D. Global dynamics of a pine wilt disease transmission model with nonlinear incidence rates. Appl. Math. Model. 2013, 37, 4561–4569. [Google Scholar] [CrossRef]
  14. Nguyen, T.V.; Park, Y.-S.; Jeoung, C.-S.; Choi, W.-I.; Kim, Y.-K.; Jung, I.-H.; Shigesada, N.; Kawasaki, K.; Takasu, F.; Chon, T.-S. Spatially explicit model applied to pine wilt disease dispersal based on host plant infestation. Ecol. Model. 2017, 353, 54–62. [Google Scholar] [CrossRef]
  15. Calvão, T.; Duarte, C.M.; Pimentel, C.S. Climate and landscape patterns of pine forest decline after invasion by the pinewood nematode. For. Ecol. Manag. 2019, 433, 43–51. [Google Scholar] [CrossRef]
  16. National Forestry and Grassland Bureau. Announcement of the National Forestry and Grassland Bureau (2019 No. 4). Available online: http://www.forestry.gov.cn/main/3457/20190424/162731641935736.html (accessed on 23 September 2020).
  17. Li, Y.-X.; Zhang, X.-Y. Analysis on the trend of invasion and expansion of Bursaphelenchusxylophilus. For. Pest Dis. 2018, 37, 1–4. [Google Scholar]
  18. Suzuki, K. Pine wilt disease—A threat to pine forest in Europe. Dendrobiology 2002, 48, 71–74. [Google Scholar]
  19. Shin, S.C. Pine Wilt Disease in Korea. In Pine Wilt Disease; Zhao, B.G., Futai, K., Sutherland, J.R., Takeuchi, Y., Eds.; Springer: Tokyo, Japan, 2008. [Google Scholar]
  20. Soliman, T.; Mourits, M.C.M.; van der Werf, W.; Hengeveld, G.M.; Robinet, C.; lansink, A.G.O. Framework for Modelling Economic Impacts of Invasive Species, Applied to Pine Wood Nematode in Europe. PLoS ONE 2012, 7, e45505. [Google Scholar] [CrossRef]
  21. Sousa, E.; Rodrigues, J.; Bonifácio, L.; Naves, P.; Rodrigues, A. Management and Control of the Pine Wood Nematode, BursaphelenchusXylophilus, in Portugal; Nova Science Publishers Inc.: New York, NY, USA, 2011. [Google Scholar]
  22. Mamiya, Y. History of Pine Wilt Disease in Japan. J. Nematol. 1988, 20, 219–226. [Google Scholar]
  23. Naves, P.; Bonifácio, L.; Sousa, E.D. The Pine Wood Nematode and Its Local Vectors in the Mediterranean Basin; Springer International Publishing: Cham, Switzerland, 2016. [Google Scholar]
  24. Zhao, B.G. Pine Wilt Disease in China; Springer International Publishing: Cham, Switzerland, 2008. [Google Scholar]
  25. Carnegie, A.J.; Venn, T.; Lawson, S.; Nagel, M.; Wardlaw, T.; Cameron, N.; Last, I. An analysis of pest risk and potential economic impact of pine wilt disease to Pinus plantations in Australia. Aust. For. 2018, 81, 24–36. [Google Scholar] [CrossRef]
  26. National Forestry and Grassland Bureau Forest Disease and Pest Control Station. China’s Forestry Biological Disaster Loss Assessment Report; National Forestry and Grassland Bureau Forest Disease and Pest Control Station: Shenyang, China, 2011.
  27. Li, L.-Y.; Gao, L.; Wen, Y.-L.; Shen, Y.-Q. Environmental Impact Eco-assessment of Pine Wood Nematode in Zhejiang Province. For. Econ. 2009, 8, 68–73. [Google Scholar]
  28. Kim, Y.H.; Kim, A.Y.; Choi, B.-H.; Han, H.-R.; Koh, Y.H. ExpansinB3 as a marker for detecting pine wood nematode-infected pine trees. J. Asia -Pac. Entomol. 2017, 20, 1228–1233. [Google Scholar] [CrossRef]
  29. Liang, W.; Yu, A.; Wang, G.; Zheng, F.; Jia, J.; Xu, H. Chitosan-based nanoparticles of avermectin to control pine wood nematodes. Int. J. Biol. Macromol. 2018, 112, 258–263. [Google Scholar] [CrossRef] [PubMed]
  30. Shan, S.-D.; You, J.-X. Income Approach and Its Application to Woodland Assessment. J. Tongji Univ. 2003, 11, 1374–1377. [Google Scholar]
  31. Liu, X.; Guo, Z.-Q.; Yao, Z.-F. The Lease Price of Fir Forest in Northwestern Fujian. J. Northwest For. Univ. 2013, 28, 249–254. [Google Scholar]
  32. D’Amato, D.; Rekola, M.; Li, N.; Toppinen, A. Monetary valuation of forest ecosystem services in China: A literature review and identification of future research needs. Ecol. Econ. 2016, 121, 75–84. [Google Scholar] [CrossRef] [Green Version]
  33. Chang, G.-B.; Tan, C.-C.; Xing, B.-S.; Liang, H.-Y. A new method of economic loss evaluation on forest pests. For. Pest Dis. 2006, 6, 9–13. [Google Scholar]
  34. Chang, G.-B.; Su, H.-J.; You, D.-K.; Zhao, J.; Mei, L.-J.; Dong, X.-B. Estimate method for the economic losses of forest pest disasters. For. Pest Dis. 2004, 4, 1–5. [Google Scholar]
  35. Liu, P.; Liang, Q.-L.; Chen, M.; Liu, Z.-J.; Sheng, Z.-H.; Su, Y.-L. Construction on Index System of Forest pest Disaster Loss Assessment. Sci. Silvae Sin. 2016, 52, 101–107. [Google Scholar]
  36. Su, H.-J.; You, D.-K.; Chang, G.-B.; Zhao, J.; Zhang, Z.-X.; Qiu, L.-X. Principle and theoretical basis of economic loss assessment of forest pest disasters. For. Pest Dis. 2004, 3, 1–4. [Google Scholar]
  37. Zhao, J. Basic Theory of Economic Evaluation on Forest Pest. J. Northeast For. Univ. 2002, 2, 82–83. [Google Scholar]
  38. Zhao, J.; Su, H.-J.; Chang, G.-B.; You, D.-K.; Chai, S.-Q.; Mei, L.-J. Evaluation system of the economic losses of forest pest disasters. For. Pest Dis. 2004, 1, 1–5. [Google Scholar]
  39. Department of Forest Resources Management, State Forestry Administration. The Seventh National Forest Resources Inventory and Forest Resources Status. For. Resour. Manag. 2010, 12, 1–8. [Google Scholar]
  40. The state forestry administration of the People’s Republic of China. Specifications for Assessment of Forest Ecosystem Services in China (LY/T 1721–2008); Standards Press of China: Beijing, China, 2008.
  41. The state forestry administration of the People’s Republic of China. Standard of Forest Pests Occurrence and Disaster (LY/T 1681–2006); Standards Press of China: Beijing, China, 2006.
  42. Li, L.-Y. Economic Evaluation and Management of Environmental Impact of Pine Wood Nematode Disease in Zhejiang Province. Ph.D. Thesis, Beijing Forestry University, Beijing, China, 2006. [Google Scholar]
  43. Huang, Z.-S.; Chen, Q. Influencing factors analysis of forestry carbon sequestration cost-benefit based on afforestation cost methods. Resour. Sci. 2016, 38, 485–492. [Google Scholar]
  44. Holmes, T.P.; Liebhold, A.M.; Kovacs, K.F.; Von Holle, B. A spatial-dynamic value transfer model of economic losses from a biological invasion. Ecol. Econ. 2010, 70, 86–95. [Google Scholar] [CrossRef]
  45. Robert, C. The value of the world’s ecosystem services and natural capital. Nature 1997, 387, 253–260. [Google Scholar]
  46. Ouyang, Z.-Y.; Wang, X.-K.; Miao, H. A primary study on Chinese terrestrial ecosystem services and their ecological-economic values. Acta Ecol. Sin. 1999, 5, 19–25. [Google Scholar]
  47. Chen, Z.-X.; Zhang, X.-S. The value of China’s ecosystem benefits. Chin. Sci. Bull. 2000, 45, 17–21. [Google Scholar]
  48. Zhao, J.-Z.; Xu, Y.-J.; Xiao, H.; Zhao, T.-Q.; Duan, G.-M. Ecosystem Services Evaluation Based on Comprehensive National Power for Sustainable Development—The Evaluations on 13 Countries. Syst. Eng. -Theory Pract. 2003, 23, 121–127. [Google Scholar]
  49. Xie, G.-D.; Zhang, C.-X.; Zhang, M.-L.; Chen, W.-H.; Li, S.-M. Improvement of the Evaluation Method for Ecosystem Service Value Based on Per Unit Area. J. Nat. Resour. 2015, 30, 1243–1254. [Google Scholar]
  50. Xie, G.-D.; Zhang, C.-X.; Zhang, C.-S.; Xiao, Y.; Lu, C.-X. The value of ecosystem services in China. J. Nat. Resour. 2015, 37, 1740–1746. [Google Scholar]
  51. Xie, G.-D.; Lu, C.-X.; Leng, Y.-F.; Zheng, D.; Li, S.-C. Ecological assets valuation of the Tibetan Plateau. J. Nat. Resour. 2003, 2, 189–196. [Google Scholar]
  52. Niu, H.-P.; Zhang, A.-L. Method of measuring ecological and social benefits of cultivated land and its application. Trans. Csae. 2010, 26, 316–323. [Google Scholar]
  53. Sun, N.-L.; Gong, Q.-W.; Zhang, J.-B. Calculation of the Value of Agroecosystems in Shandong Province. China Popul. Resour. Environ. 2011, 21, 128–132. [Google Scholar]
  54. Li, J.-W.; Ling, T.; Ma, Y.-T. Prevention and Control of Bursaphelenchusxylophilus in QinlingMountians within Shaanxi Province. Shaanxi For. Sci. Technol. 2013, 6, 118–121. [Google Scholar]
  55. Yu, H.-Y. New host plants and new vectors of pine wood nematodes found in Liaoning. For. Pest Dis. 2018, 37, 61. [Google Scholar]
  56. Ning, T.; Fang, Y.-L.; Tang, J.; Sun, J.-H. Advances in research on Bursaphelenchusxylophilus and its key vector Monochamus spp. Entomol. Knowl. 2004, 2, 97–104. [Google Scholar]
  57. Yang, B.-J.; Wang, L.-F.; Zhao, W.-X.; Xu, F.-Y.; Zhang, P.; Li, Z.-P. The Latent Infection of Bursaphelenchusxylophilus and a New Transmission Way of PWN by Monochamusalternatus. For. Res. 2002, 3, 251–255. [Google Scholar]
  58. Campbell, E.T.; Tilley, D.R. Valuing ecosystem services from Maryland forests using environmental accounting. Ecosyst. Serv. 2014, 7, 141–151. [Google Scholar] [CrossRef]
  59. Häyhä, T.; Franzese, P.P.; Paletto, A.; Fath, B.D. Assessing, valuing, and mapping ecosystem services in Alpine forests. Ecosyst. Serv. 2015, 14, 12–23. [Google Scholar] [CrossRef]
  60. Ninan, K.N.; Inoue, M. Valuing forest ecosystem services: Case study of a forest reserve in Japan. Ecosyst. Serv. 2013, 5, 78–87. [Google Scholar] [CrossRef]
  61. Chan, K.M.A.; Guerry, A.D.; Balvanera, P.; Klain, S.; Satterfield, T.; Basurto, X.; Bostrom, A.; Chuenpagdee, R.; Gould, R.; Halpern, B.S.; et al. Where are Cultural and Social in Ecosystem Services? A Framework for Constructive Engagement. Bioscience 2012, 62, 744–756. [Google Scholar] [CrossRef]
  62. Milcu, A.I.; Hanspach, J.; Abson, D.; Fischer, J. Cultural Ecosystem Services: A Literature Review and Prospects for Future Research. Ecol. Soc. 2013, 18, 34. [Google Scholar] [CrossRef] [Green Version]
Figure 1. Trends in areas infected by pine wood nematode disease in mainland China from 1998 to 2017.
Forests 11 01042 g001
Figure 2. The area of pine wood nematode disease in the province level of mainland China from 1998 to 2017.
Forests 11 01042 g002
Figure 3. Trends of economic loss of pine wood nematode disease in mainland China from 1998 to 2017.
Forests 11 01042 g003
Figure 4. Average economic losses of pine wood nematode disease in mainland China from 1998 to 2017.
Forests 11 01042 g004
Table 1. Evaluation index system for economic loss of pine wood nematode disease.
Evaluation MethodSecondary IndicatorTertiary Indicator
Direct Economic LossLoss of forest material resourcesLoss of forest volume
Loss of forest by-products
Loss of prevention and control expenditureLoss of prevention and control expenditure
Ineffective forestry expenditureIneffective afforestation expenditure
Ineffective tending expenditure
Ineffective management and maintenance expenditure
Indirect Economic LossAdjustment service value lossLoss of gas conditioning service
Loss of climate regulation service
Loss of purification of environmental service
Loss of hydrological regulation service
Support service value lossLoss of soil conservation services
Loss of nutrient recycling service
Loss of biodiversity service
Cultural service value lossLoss of aesthetic landscape service
Table 2. Parameter description table.
ParameterDescriptionValue/Unit
T a Forest price per unit stock341.18 (CNY/m3)
A d Annual growth loss per unit area3.55 (m3/hm2)
Y Annual average yield per unit area of healthy forests1350 (kg/hm2)
P The average price of pine resin in its origin15.25 (CNY/kg)
C p Prevention and control expenditure per unit area1783.50 (CNY/hm2)
C c Afforestation expenditure per unit area14,293.15 (CNY/hm2)
C t Tending expenditure per unit area1748.22 (CNY/hm2)
C m Management and maintenance expenditure per unit area.1260.74 (CNY/hm2)
Table 3. Equivalent service value of forest ecosystem per unit area of coniferous forest.
Service TypeService FunctionEquivalent Factor
Regulating serviceGas regulation1.70
Climate regulation5.07
Purifying the environment1.49
Hydrological regulation3.34
Support serviceSoil retention2.06
Maintain nutrient cycling0.16
Biodiversity1.88
Cultural serviceAesthetic landscape0.82

